Modeling
Frame View
In Perform3D, a Frame view can be used to simplify and organize the display and definition of the structure by showing only selected parts of the structure. You can quickly toggle between a full structure view and a view showing only the elements in frame view while defining the model.
Import from SAP2000 and ETABS
Perform3D models can be exported from SAP2000 or ETABS and serve as a starting point for your Perform3D model.
Import of Structural Geometry Through Text Files
Nodes, element geometry, masses and nodal loads can be imported using a comma-delimited text file
Elements and Components
Elements and Components
Perform3D includes the following element types:
- • Frame elements for beams, columns and braces.
- • Wall element for shear walls.
- • Slab element for floors.
- • Axial-only bar elements, including gap and hook elements.
- • Seismic isolators of rubber and friction pendulum type.
- • Buckling restrained brace.
- • Infill panel, with only shear strength and stiffness.
- • Fluid damper, with nonlinear relationship between force and deformation rate.
- • Connection panel zone, to model shear deformation in beam-to-column connections.
- • Deformation "Gages" of various types. These elements have no stiffness and are used for performance assessment and reporting.
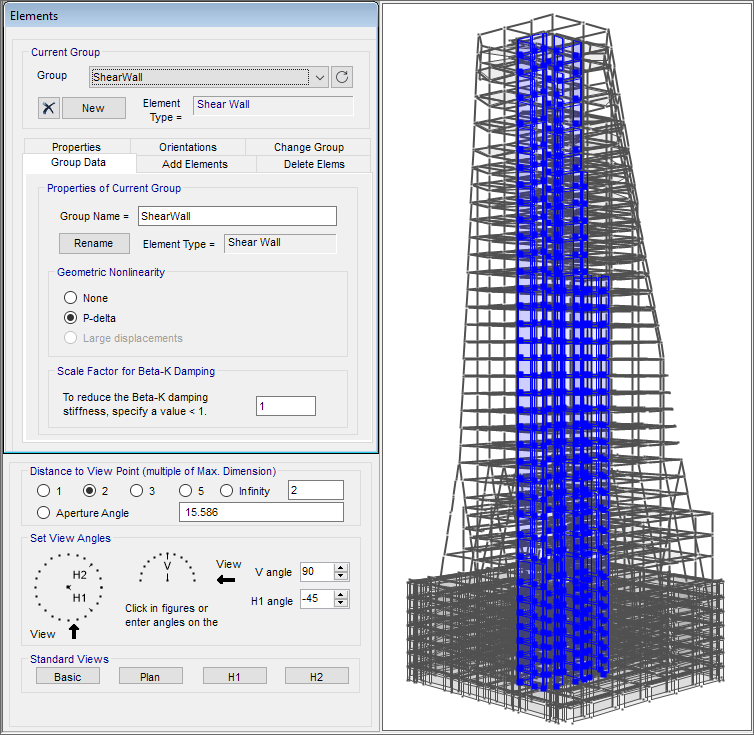
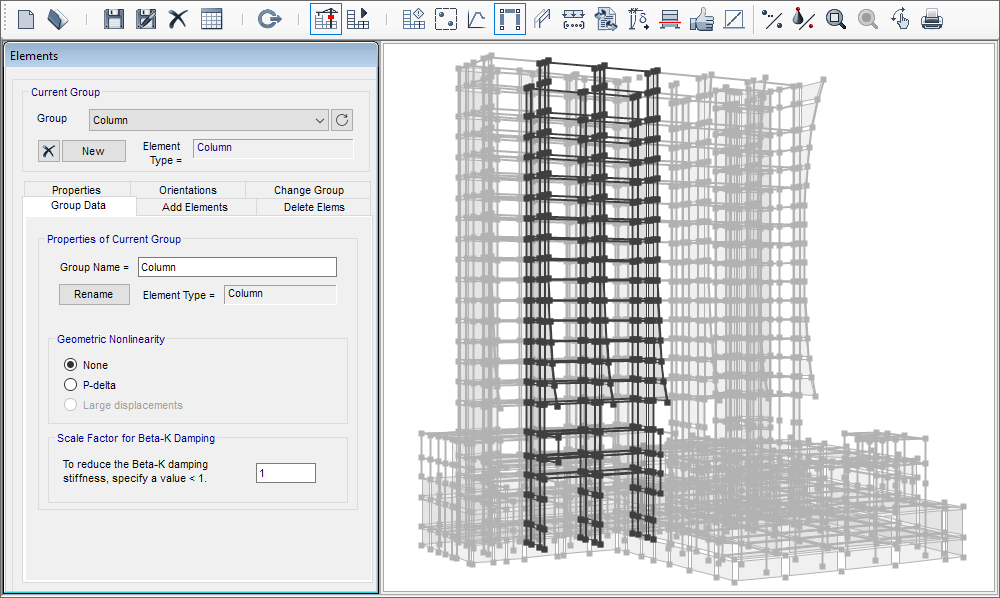
Customize frame element properties through the use of multiple elastic and inelastic components in a compound component.
In Perform3D, frame elements are made up of a number of components, such as elastic sections, nonlinear hinges, releases, and end zones. For example, a nonlinear column might consist of several components.
Inelastic Components
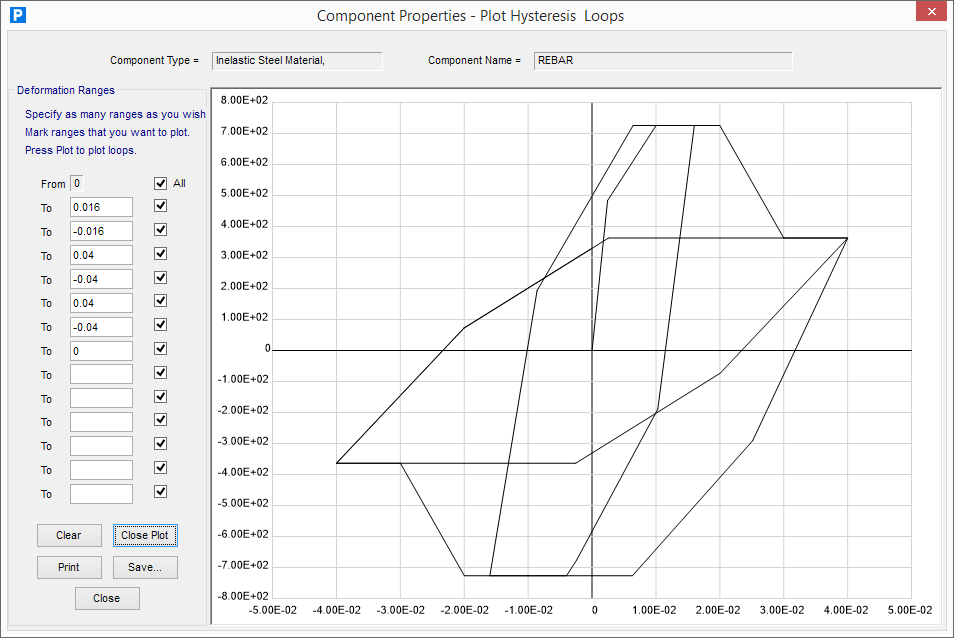
Trilinear backbone curve with energy degradation
Inelastic components can have either an elastic-perfectly-plastic or tri-linear force-deformation relationship, with optional strength loss. The hysteresis loop for an inelastic component can be varied to account for stiffness degradation. The hysteresis loop can be plotted while defining the component properties to check that it has the expected shape.
Nonlinear concrete and steel materials, including buckling steel material
The following inelastic components are among those available in Perform3D:
- • Nonlinear concrete and steel materials, including buckling steel material
- • Nonlinear M3 and V2 hinges for beams
- • Nonlinear coupled P-M2-M3 and V2-V3 hinges for columns
- • Nonlinear fiber sections for beams and columns
- • Nonlinear P-M3 fiber sections and elastic or inelastic shear behavior for shear wall modeling
Response Measures
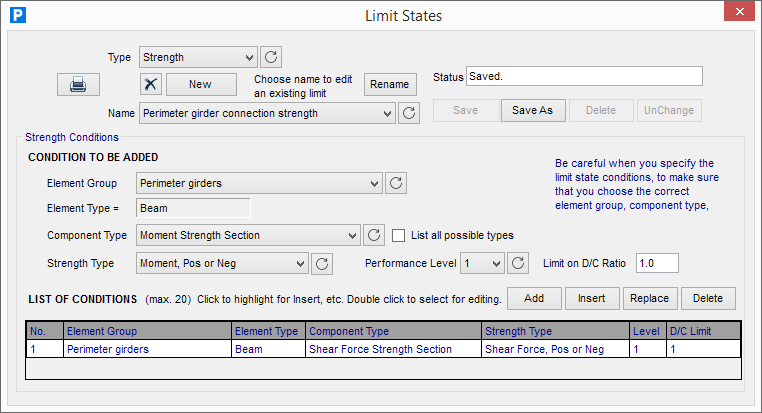
Limit States
The number of components with D/C ratios can be very large. To simplify decision making, components that have similar D/C measures can be grouped into Limit States. Deformation D/C ratios can be used to check that inelastic components have sufficient ductility while strength D/C ratios can be used to check that elastic components have sufficient strength to remain elastic.
Strain gages
Limit states can be defined using the following response measures:
- • Component deformation capacities
- • Component strength capacities
- • Strain gage deformation capacities
- • Drift, deflections, and structure sections
Load Cases and Analysis
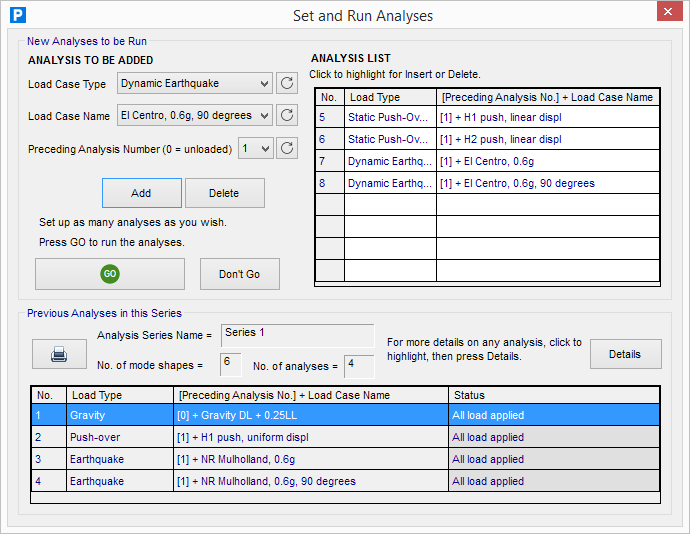
Analysis Series
In Perform3D, analyses are part of an analysis series. For each analysis series, the following structure properties can be changed:
- • The mass distribution and magnitude. This can affect static push-over analysis as well as dynamic response history analysis.
- • The amount and type of damping for dynamic response history analysis.
- • The strengths and stiffnesses of structural components with Upper/Lower Bound feature enabled in the component properties.
Analysis Types
Perform3D can run the following analysis types:
- • Mode shapes, periods, and effective mass factors
- • Gravity load
- • Static push-over
- • Response history for earthquake ground motion
- • Response history for dynamic forces
- • Response spectrum analysis
Multiple analysis series can be defined in a model to allow for parametric studies.
Up to 8 analysis series can be run in parallel.
Behavior Check
Behavior Check
Perform3D includes a number of tools for processing the analysis results. One set of tools allows you to study the behavior of a structure, and to check that the analysis look reasonable.
Deformed Shapes
These can be animated, for both static push-over and dynamic response history analysis.
Moment and Shear Diagrams
Moment and shear diagrams for beams, columns, and shear walls, which can be animated.
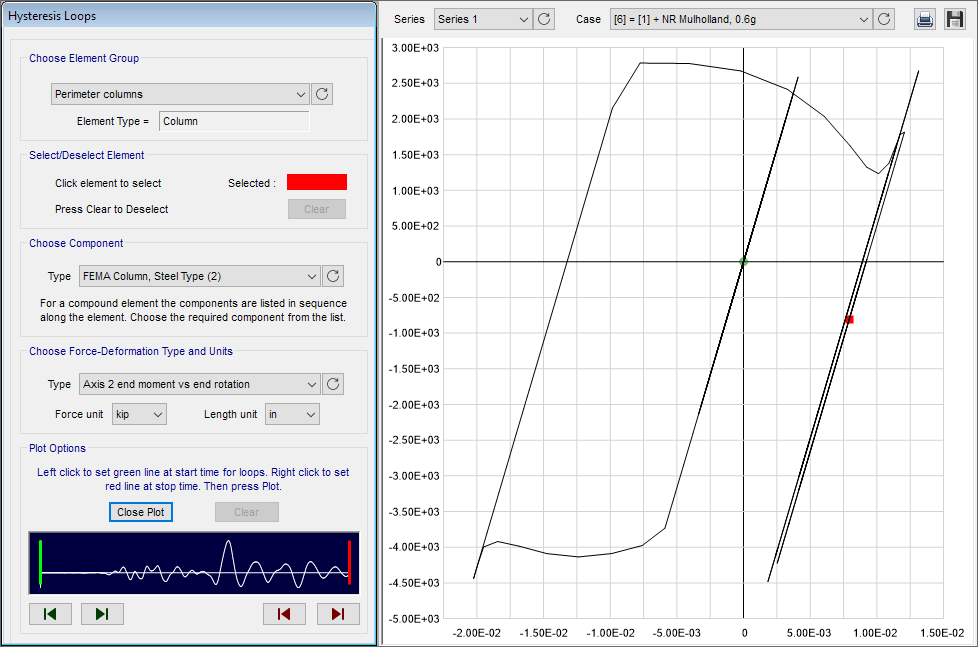
Hysteresis Loops for Inelastic Components
After running analysis, force-deformation plots of all inelastic components, including hinges, isolators and dampers, can be viewed and used to check the inelastic behavior.
Time Histories
Time histories of many response quantities, including node displacements, velocities and accelerations; element and component forces and deformations; and forces on “structure sections” that cut through all or parts of the structure.
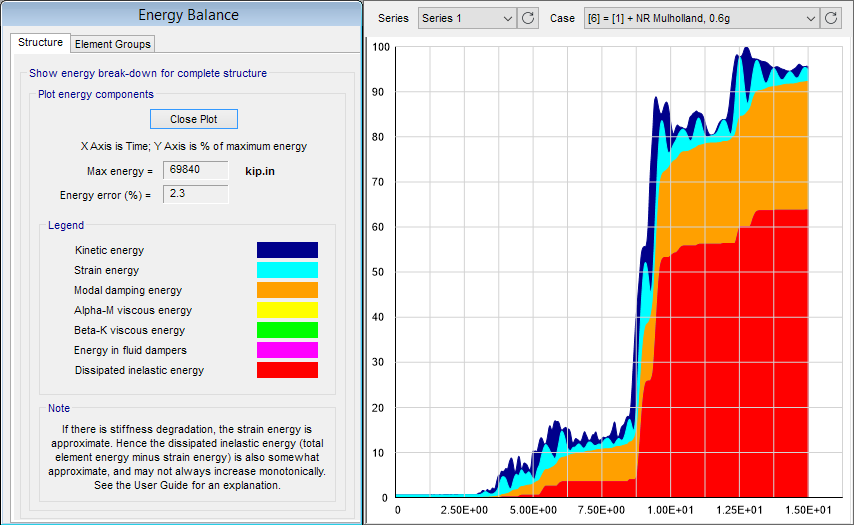
Energy Balance, Showing Strain Energy, Kinetic Energy, Inelastic Work, and Damping Energy
This includes a comparison of external and internal work, which provides a good indication of the numerical accuracy of the analysis.
Performance Assessment
Performance Assessment
The results of an analysis are useful only if they are presented in a way that supports decision making for design. Perform3D includes powerful tools that assess the performance of a structure, and hence support design.
Target displacement calculation for pushover analysis.
Target displacement calculation can be performed using the FEMA 356 Coefficient Method.
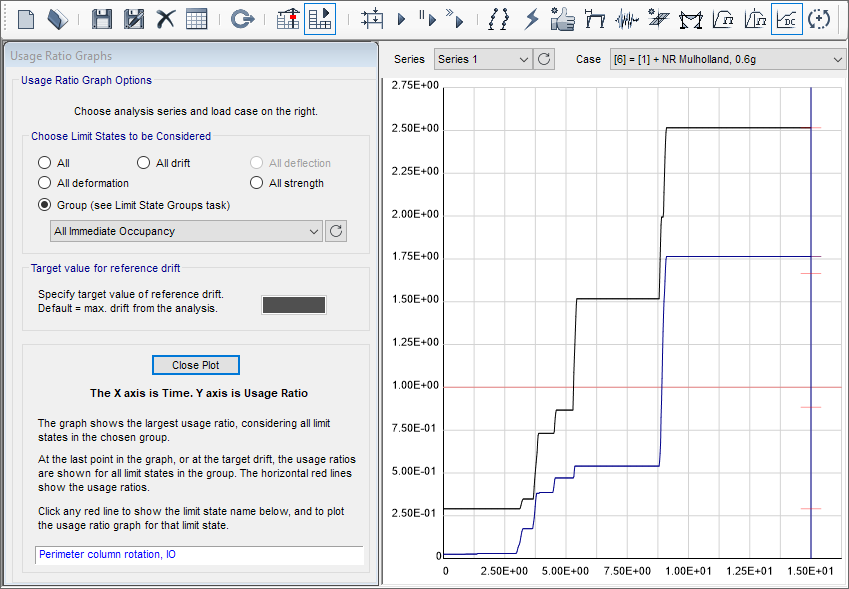
Usage ratio plots for single load cases.
As the drift increases in a push-over analysis, or time increases in a response-history analysis, the usage ratios for the limit states progressively increase. A usage ratio plot shows how the usage ratios vary for user-selected groups of limit states.
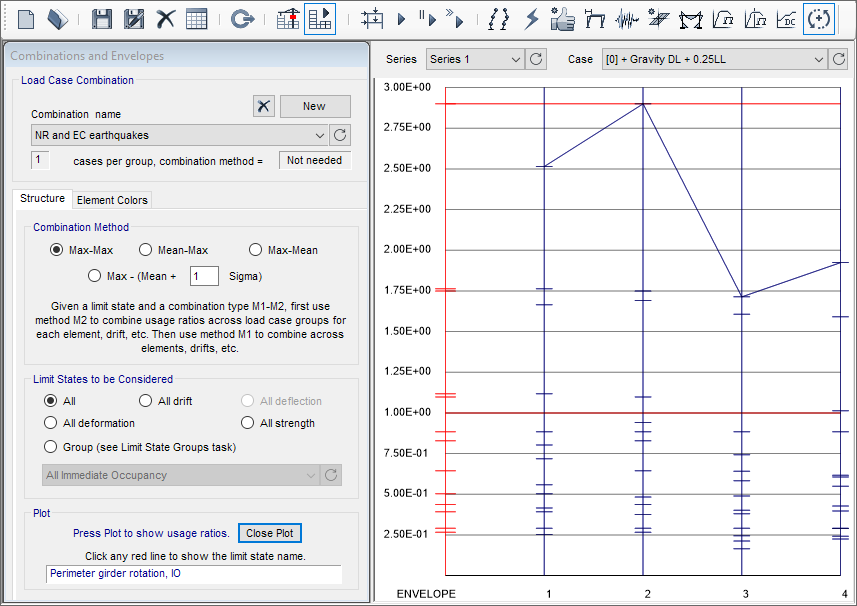
Usage ratio envelopes for load combinations.
It is common practice to run response history analyses for several earthquakes (often 7 or more), and to assess performance based on the mean values of the usage ratios.
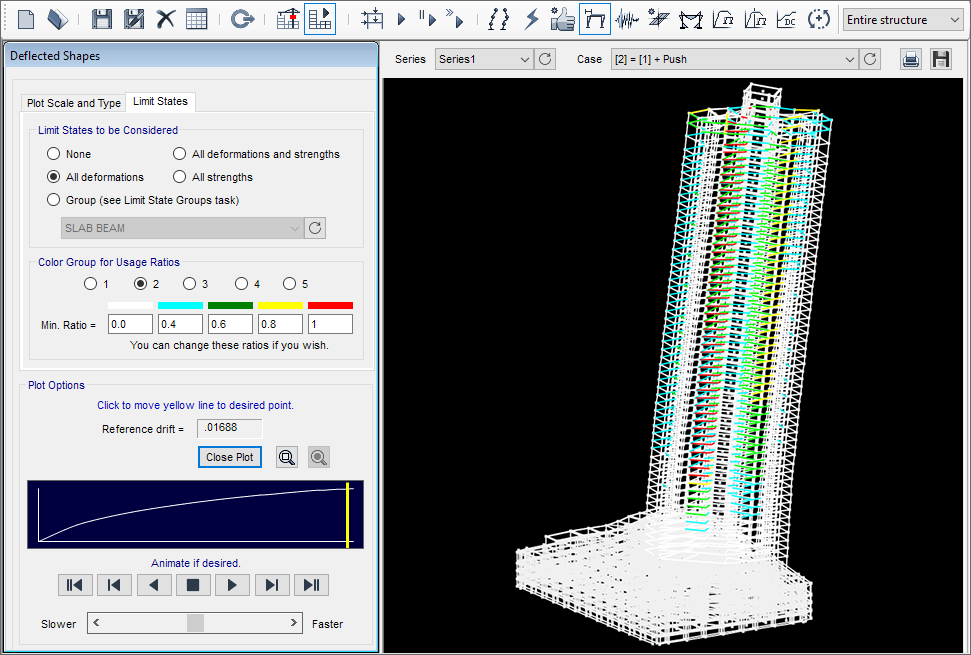
Deflected shapes with color coding based on D/C ratio.
These can be used to identify hot spots where the components are most heavily deformed.
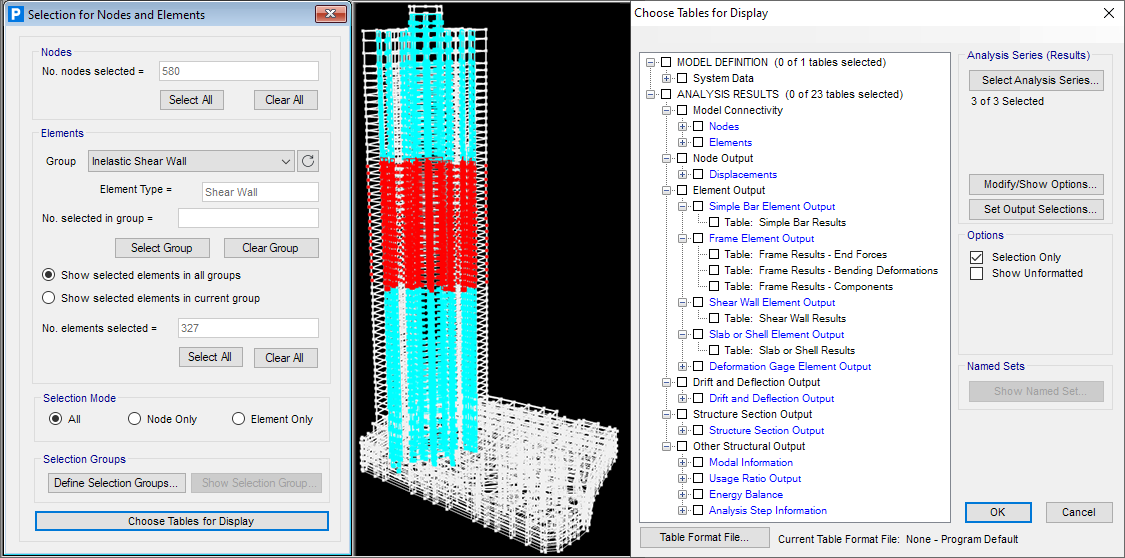
Results Output and Database Tables
Tabulated analysis results and performance measures available in Database tables
Tabulated results are exportable to text, XML, Excel, and Access formats.
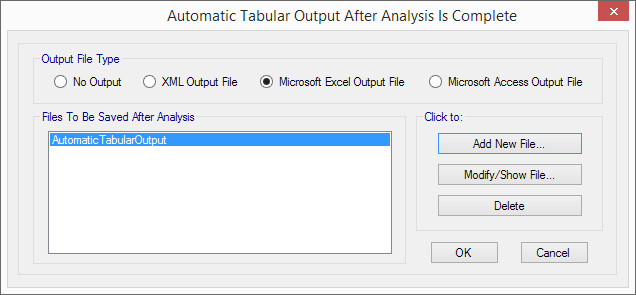
Automated tabular output after analysis is complete
A Table Named Set and Table Selection Group can be specified to limit the output content for each tabular output file.